Evaluating Fine-Tuned Models
When evaluating AI models, we commonly use metrics such as Accuracy, Precision, Recall, and F1 Score to determine how well the model performs.
Accuracy
Accuracy measures the proportion of correct predictions made by the model. For instance, if a model makes 100 predictions and gets 90 of them correct, the accuracy is 90%.
Consider accuracy like seeing how many questions a student got right on a test. If they got 90 out of 100 correct, the accuracy is 90%.
Precision
Precision measures how many of the items predicted as 'true' by the model are actually 'true'. For example, if the model predicts 10 items as 'true', and 8 of them are indeed 'true', the precision is 80%.
Think of precision as evaluating how often a detective correctly identifies real suspects among those he arrests. If the detective arrests 10 people and 8 of them are actual perpetrators, precision is 80%.
Recall
Recall measures how many of the actual 'true' items the model identified correctly. For instance, if there are 10 actual 'true' items and the model correctly identifies 7 of them, the recall is 70%.
Imagine recall as the detective's ability to catch all the perpetrators. If there are 10 perpetrators and the detective catches 7, the recall is 70%.
F1 Score
F1 Score is the harmonic mean of precision and recall. High F1 Score means both precision and recall are balanced and strong. It's useful for evaluating the overall performance of the model by considering both precision and recall.
The F1 Score is like a report card for the detective on how accurately (precision) and how comprehensively (recall) he arrests the criminals. Both are important, so if either is too low, the overall score suffers.
Loss Graphs
However, OpenAI does not provide the aforementioned four metrics for fine-tuned models.
Instead, they provide Training Loss and Validation Loss.
Training Loss represents the average loss on the training data, while Validation Loss indicates the average loss on the validation data.
These loss values serve as indicators of how well the model is performing during training. Lower loss values generally indicate better model performance.
Therefore, if the loss values shown in the OpenAI loss graphs continue to decrease, it indicates successful training.
Example of Training Loss Graph Provided by OpenAI
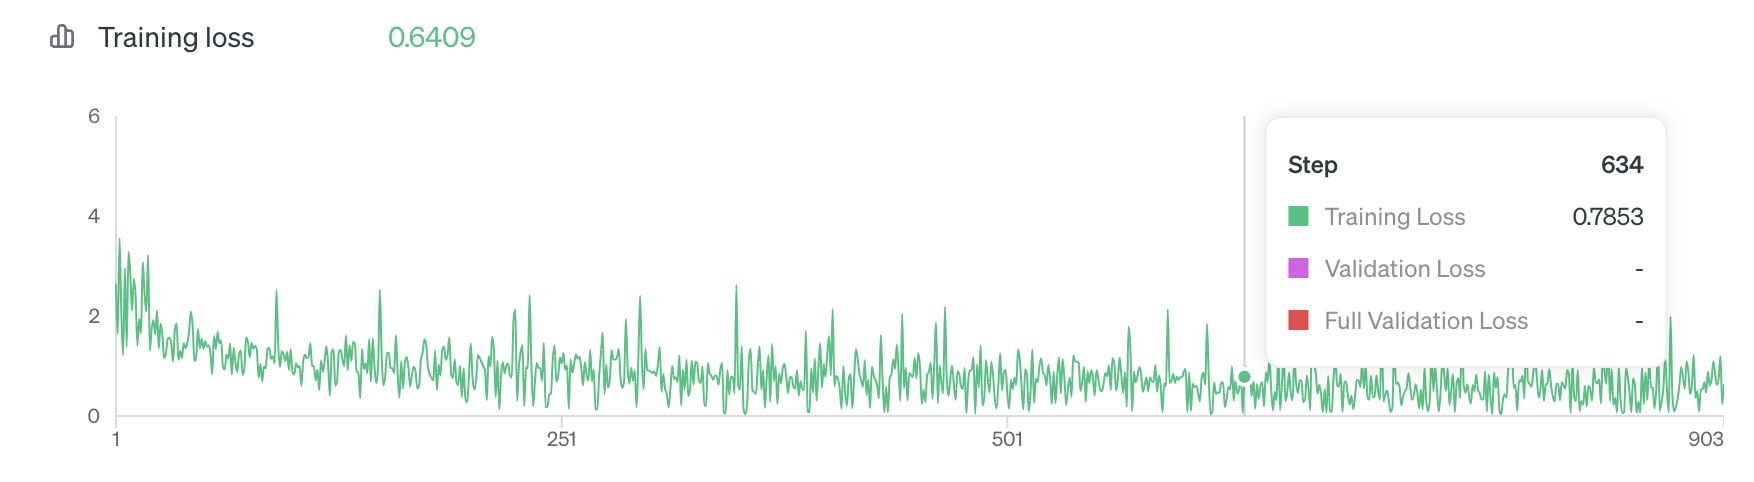
The graph above demonstrates Training Loss as it progresses through different Steps. Initially, the training loss starts at a high value near 4, improves to 0.7853 in the middle, and finally converges to 0.6409.
What is the appropriate word for the blank below?
Lecture
AI Tutor
Design
Upload
Notes
Favorites
Help