Make Complex Information Simple! Data Visualization
In the previous lesson, we learned how to convert unorganized data copied and pasted from spreadsheets like Excel into CSV format, and how to analyze data based on CSV.
However, when writing reports, there are times when it’s necessary to convert data into graphs or charts for better clarity at a glance.
While it's possible to create graphs directly in spreadsheet programs like Excel, you can also use ChatGPT to generate graphs in an instant.
Although text-generating AI itself cannot draw graphs, ChatGPT can analyze your prompts to visualize data using Python code.
Simply add a phrase like Draw a graph (or chart) based on the data to your prompt, and ChatGPT will generate a graph using Python data visualization tools.
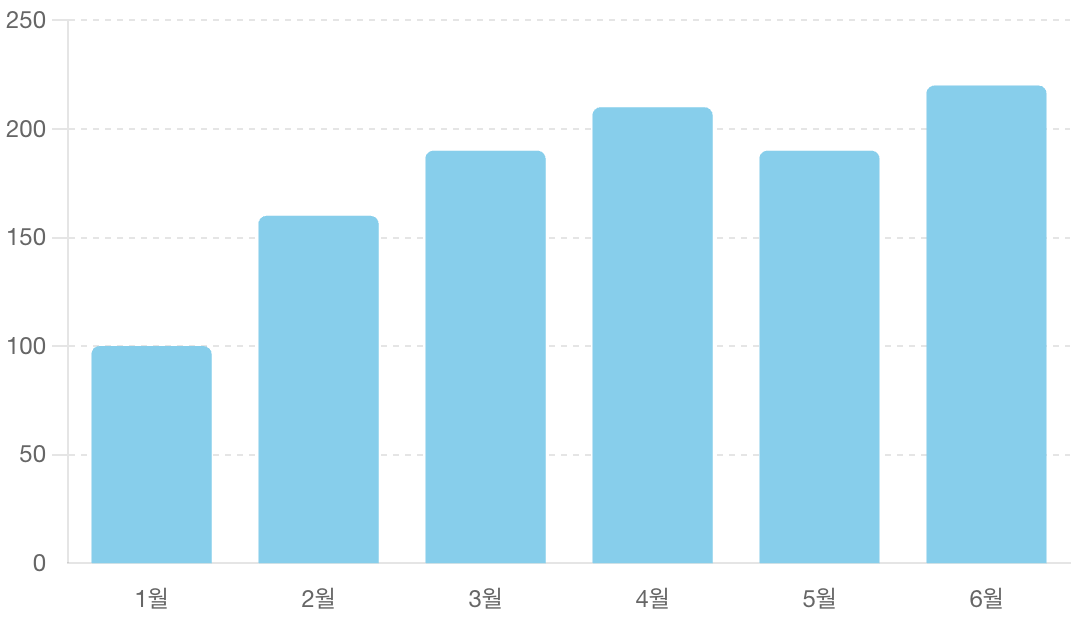
Below is the sales data from January to June 2021. Month,Sales 1,100 2,160 3,190 4,210 5,190 6,220 Please visualize the monthly sales data as a bar graph.
When you give this prompt to ChatGPT, it will generate a bar graph based on the provided data.
Points to Note
ChatGPT primarily uses a Python library called matplotlib for data visualization. However, since matplotlib does not support non-standard fonts by default, characters may appear corrupted, as shown below.
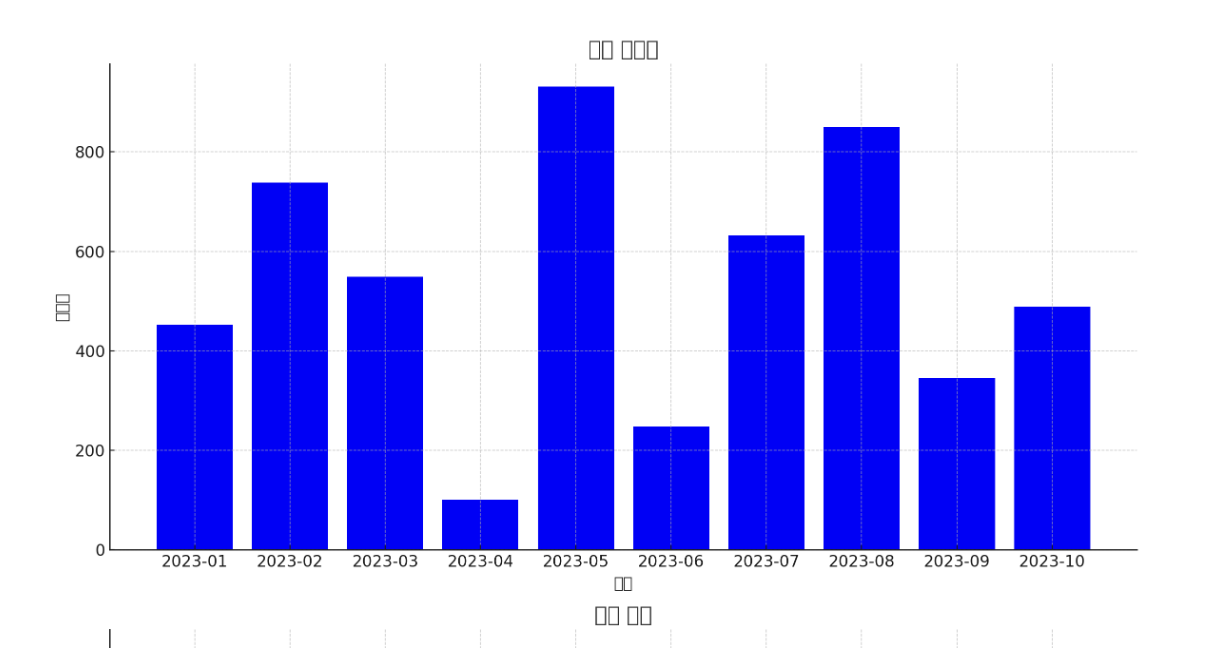
Therefore, you can request adjustments for the graph where characters appear corrupted or specify in your prompt, Ensure characters do not appear corrupted by using standard English fonts.
Below is the sales data from January to June 2021. Month,Sales 1,100 2,160 3,190 4,210 5,190 6,220 Please visualize the monthly sales data as a bar graph. Ensure characters do not appear corrupted by using standard English fonts.
Practice
Send prompt examples and compare AI responses.
Notice
CodeFriends offers prompt practice using text-generating AI provided by OpenAI.
However, unlike ChatGPT, this text-generating AI does not offer data visualization capabilities.
If you wish to practice data visualization, please copy the example prompts and conduct your practice using ChatGPT.
What Python library does ChatGPT primarily use for data visualization?
numpy
matplotlib
pandas
scikit-learn
Lecture
AI Tutor
Design
Upload
Notes
Favorites
Help